Oxford Spires Dataset
Yifu Tao, Miguel Ángel Muñoz-Bañón, Lintong Zhang, Jiahao Wang, Lanke Frank Tarimo Fu, Maurice Fallon

News
(12 May 2025) Paper accepted for publication in the International Journal of Robotics Research (IJRR).
(11 May 2025) Dataset available at Hugging Face.
(10 March 2025) You can find the recently revised paper here.
Overview
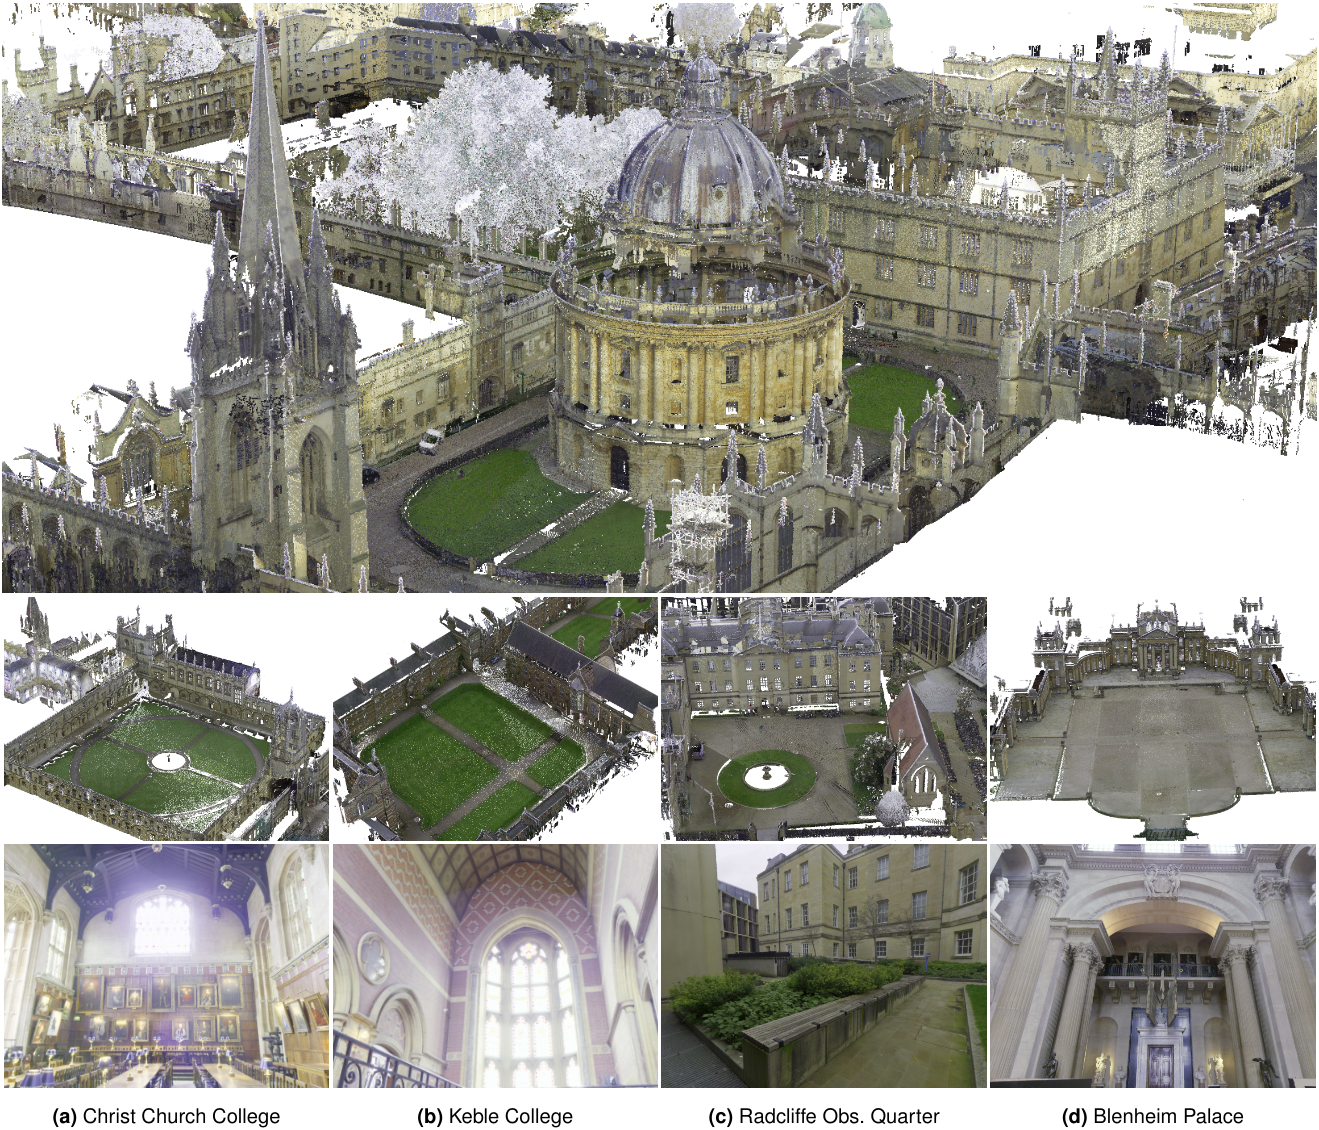
We present the Oxford Spires Dataset, captured in and around well-known landmarks in Oxford using a custom-built multi-sensor perception unit as well as a millimetre-accurate map from a terrestrial LiDAR scanner (TLS). The perception unit includes three global shutter colour cameras, an automotive 3D LiDAR scanner, and an inertial sensor — all precisely calibrated.
Handheld Perception Unit
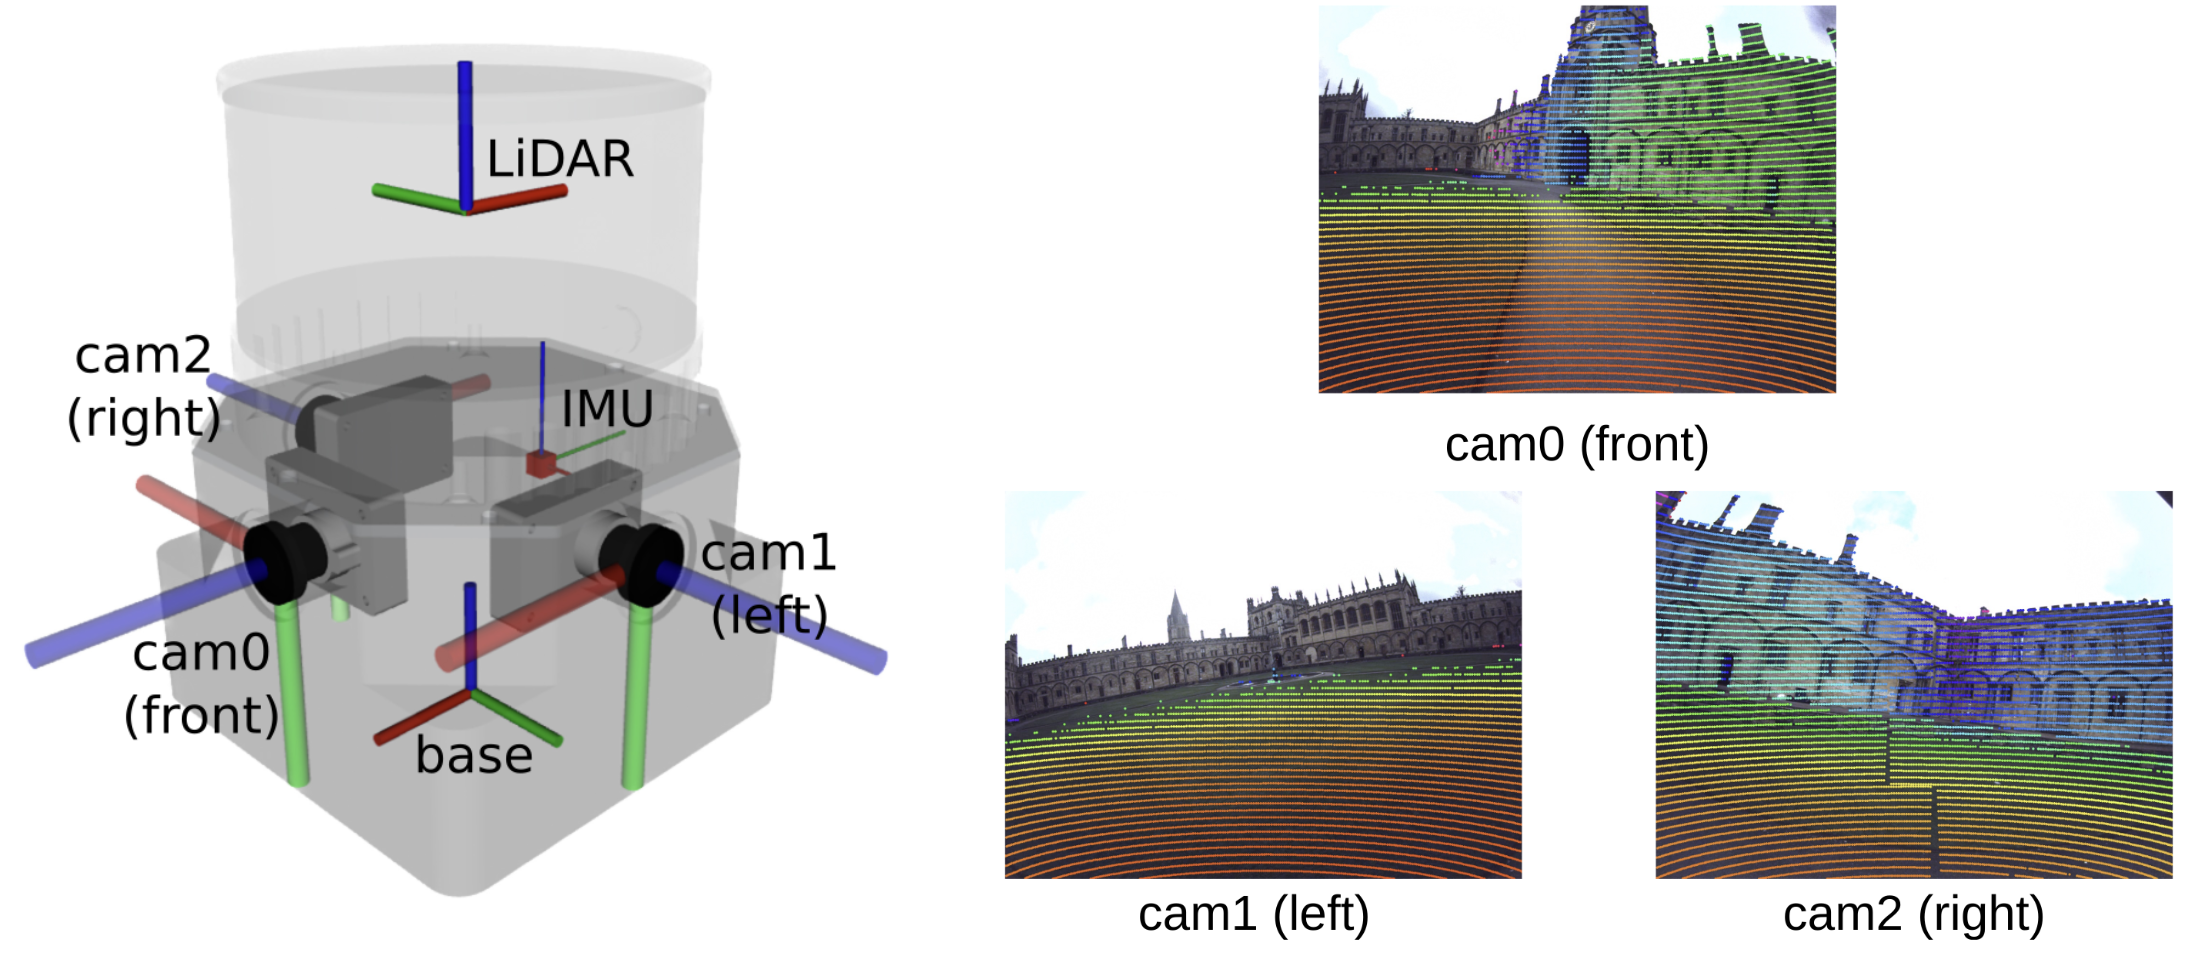
Our perception unit, Frontier, has three cameras, an IMU, and a LiDAR. It is shown in the figure below. The three colour fisheye cameras face forward, left, and right. The LiDAR was mounted on top of the cameras. In the table below, we show the specifications for each sensor, while in the next table, we show the ROS topics provided for each sensor.

| Sensor | Type | Rate [Hz] | Description |
|---|---|---|---|
| Hesai QT64 | LiDAR | 10 | 64 channels, 60m max. range, 104° vertical FoV |
| Alphasense Core Development Kit | IMU | 400 | Cellphone-grade, synchronised with the cameras |
| Alphasense Core Development Kit | 3 cameras | 20 | Colour fisheye, 126°×92.4° FoV, resolution 1440 × 1080, 36° overlap, synchronised with IMU |
| Topic | Rate [Hz] | Description |
|---|---|---|
/hesai/pandar |
10 | LiDAR pointclouds |
/alphasense_driver_ros/imu |
400 | IMU measurements |
/alphasense_driver_ros/cam0/color/image/compressed |
20 | Front camera images |
/alphasense_driver_ros/cam1/color/image/compressed |
20 | Left camera images |
/alphasense_driver_ros/cam2/color/image/compressed |
20 | Right camera images |
Calibration: The camera intrinsics and camera-IMU extrinsics were calibrated with Kalibr (Furgale et al., 2013). The camera-LiDAR extrinsics were calibrated with DiffCal (Fu et al., 2023). All of the intrinsic and extrinsic sensor calibration parameters are available in the dataset. LiDAR overlay in the images using this calibration is shown above.
The sensor calibration can be found in both the Google Drive and the Github code repository. The calibration targets’ specifications are available in the Google Drive and HuggingFace.
Dataset Recording
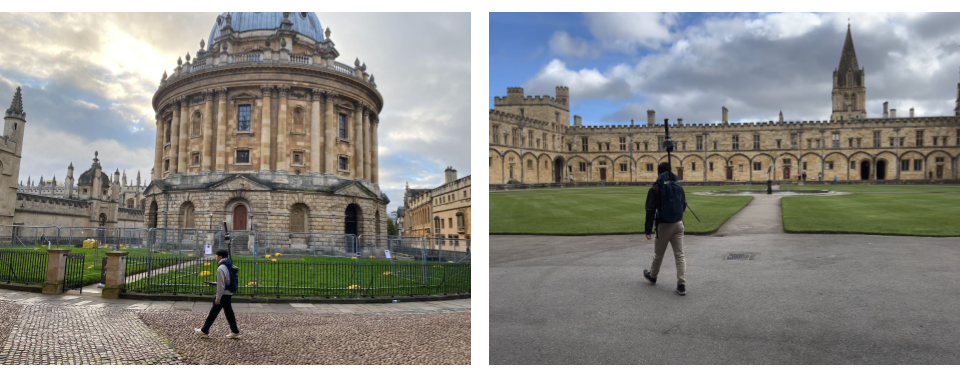
The above-described Frontier device was mounted in a backpack (figure below). We carried this backpack through the different sites to record the sequences described in the Sites and Sequence section.

Ground Truth
For ground-truthing, we used a Leica RTC360 TLS (figure below, left). It has a maximum range of 130 m and a Field-of-View of 360° × 300°. The final 3D point accuracy is 1.9 mm at 10 m and 5.3 mm at 40 m. The point clouds are coloured using 432 mega-pixel images captured by three cameras.
We scanned the dataset’s sites from different static locations (figure below, right). From each scan, we obtained a colourised 3D point cloud.

3D reference model (TLS map): We provide the individual scans recorded as commented before (figure above, right) for each site. Moreover, we provide a merged version for each site (1cm resolution), where the scans are registered using Leica’s Cyclone REGISTER 360 Plus software. The average cloud-to-cloud error in our sites ranges from 3 to 7 mm.
Trajectory GT: The ground truth trajectory is computed by ICP registering each Frontier’s undistorted LiDAR point cloud to the TLS map described before. We do this similarly for Newer College (Ramezani et al. 2020b) and Hilti-2022 (Zhang et al. 2022). The accuracy of the ground truth trajectory is approximately 1-2 cm. The ground truth pose is in the base frame, which is defined with respect to the lidar with the transformation matrix T_base_lidar.
Sites and Sequence
The table below provides information about the data recorded in the different sites. We provide the dates, the number of sequences recorded and the sum of the lengths for all sequences in each site. Additionally, we provide information about if the site contains indoor parts in sequences.
| Site | Date | Sequences | Length (km) | Out-In |
|---|---|---|---|---|
| Bodleian Library | 2024-03-15 2024-05-20 2024-10-29 | 2 | 1.29 | Outdoor |
| Blenheim Palace | 2024-03-14 | 5 | 2.18 | Outdoor-indoor |
| Christ Church College | 2024-03-18 2024-03-20 | 6 | 4.12 | Outdoor-indoor |
| Keble College | 2024-03-12 | 5 | 2.87 | Outdoor-indoor |
| Radcliffe Observatory Quarter | 2024-03-13 | 2 | 0.79 | Outdoor |
| New College | 2024-07-09 | 4 | 1.66 | Outdoor-indoor |
Core Sequences
We have selected a set of sequences as the core sequences, with the rest as additional sequences.
The core sequences correspond to the ones used for the localisation benchmark in the paper which are paired with ground truth lidar trajectories.
2024-03-12-keble-college-02
2024-03-12-keble-college-03
2024-03-12-keble-college-04
2024-03-12-keble-college-05
2024-03-13-observatory-quarter-01
2024-03-13-observatory-quarter-02
2024-03-14-blenheim-palace-01
2024-03-14-blenheim-palace-02
2024-03-14-blenheim-palace-05
2024-03-18-christ-church-01
2024-03-18-christ-church-02
2024-03-18-christ-church-03
2024-03-18-christ-church-05
2024-05-20-bodleian-library-02
Folder structure
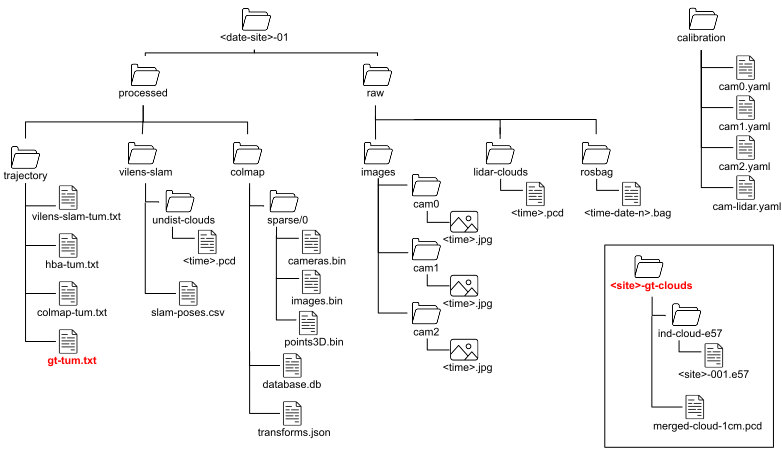
In the figure below, we show the folder structure of the dataset. The data from the sensors described before is located in the raw folder. Apart from the raw, we provide processed data from VILENS-SLAM, including the undistorted point clouds, and COLMAP including the processed images. The trajectory folder contains those trajectories in TUM format. The ground truth for TLS map and trajectory is marked in red in the figure.

Image processing
Although we provide processed images in the dataset, the images in the rosbags are the raw images. For this reason, we provide a ROS2 package (with a branch in ROS1) to process the images provided in the rosbags, which includes white-balancing, gamma correction, vignetting, etc.:
You can run the launch file:
raw_image_pipeline/raw_image_pipeline_ros/launch/raw_image_pipeline_node.launch
The launch file should be configured with the input topic:
<arg name="input_topic" default="alphasense_driver_ros/cam0/debayered/image/compressed"/>
It is possible to select the modules in the launch file. Below is an example of white balance:
<!-- Modules -->
<arg name="debayer/enabled"                      default="false"/>
<arg name="flip/enabled"                         default="false"/>
<arg name="white_balance/enabled"                default="true"/>
<arg name="color_calibration/enabled"            default="false"/>
<arg name="gamma_correction/enabled"             default="false"/>
<arg name="vignetting_correction/enabled"        default="false"/>
<arg name="color_enhancer/enabled"               default="false"/>
<arg name="undistortion/enabled"                 default="false"/>
Code
We have a Github repository which provides software to download the data and run the localisation, reconstruction and novel-view synthesis benchmarks.
GoogleDrive
Citation
@article{tao2025spires,
title={The Oxford Spires Dataset: Benchmarking Large-Scale LiDAR-Visual Localisation, Reconstruction and Radiance Field Methods},
author={Tao, Yifu and Mu{\~n}oz-Ba{\~n}{\'o}n, Miguel {\'A}ngel and Zhang, Lintong and Wang, Jiahao and Fu, Lanke Frank Tarimo and Fallon, Maurice},
journal={International Journal of Robotics Research},
year={2025},
}
Contact
We encourage you to pose any issue in Github Issues. You can also contact us via email.
License
This work is licensed under a Creative Commons Attribution-NonCommercial-ShareAlike 4.0 International License and is intended for non-commercial academic use. If you are interested in using the dataset for commercial purposes please contact us via email.


